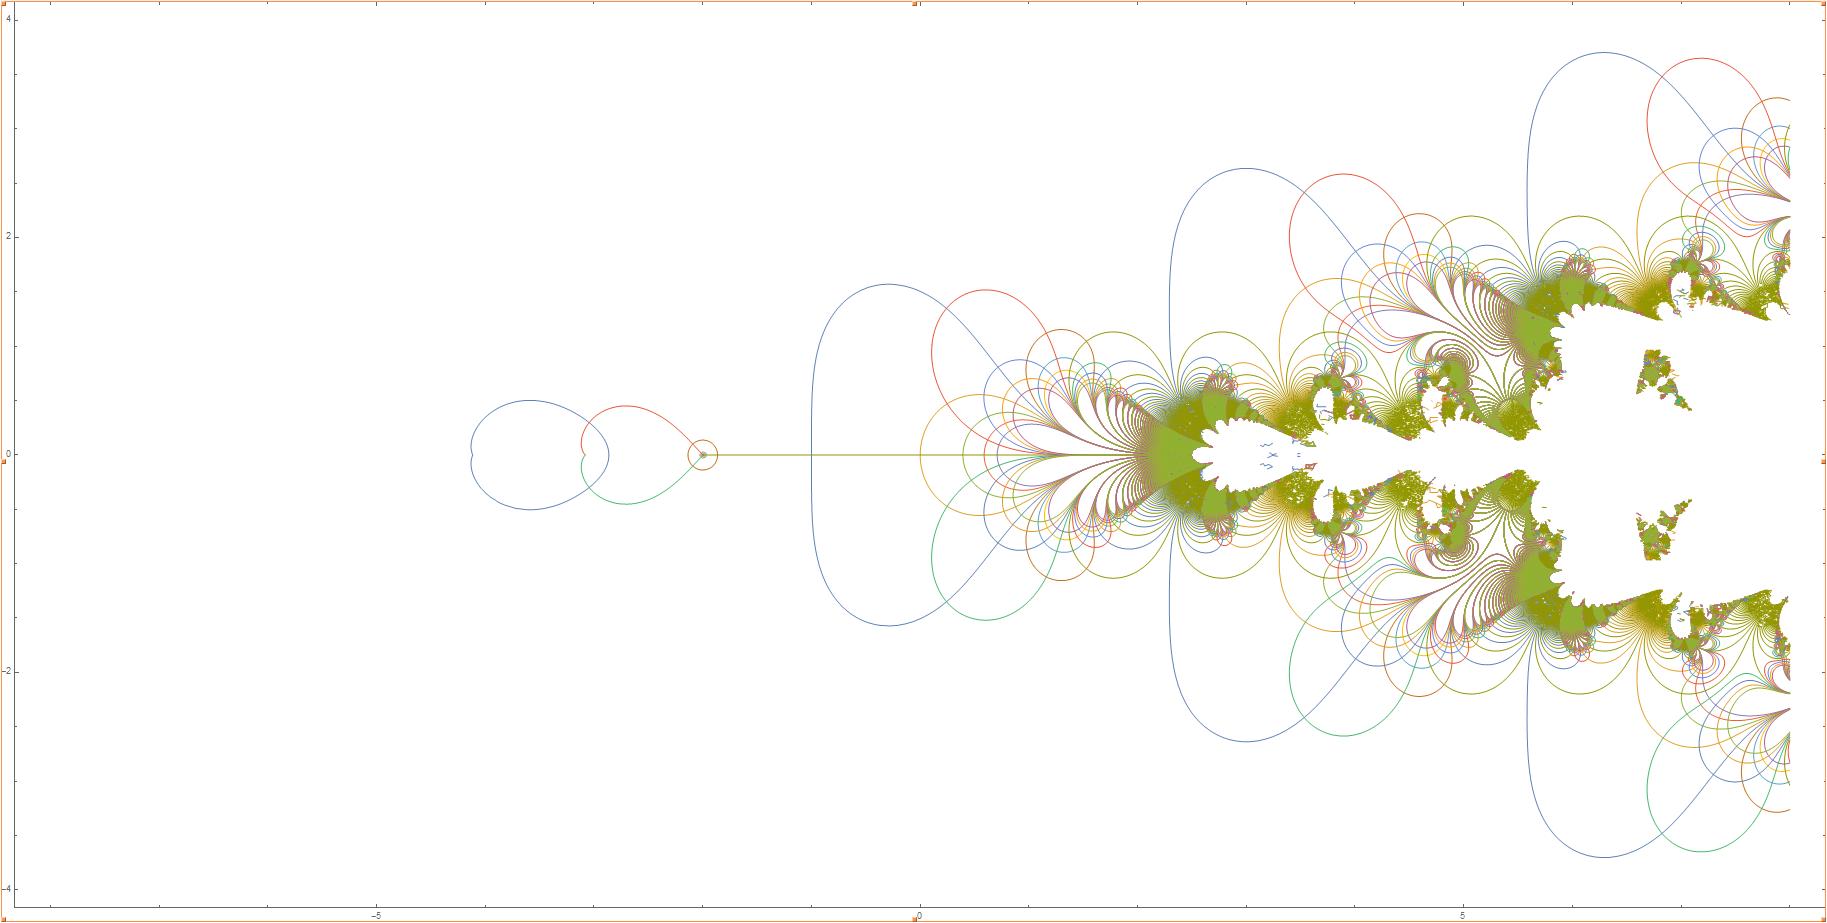
The "ears" and "wagonwheels" are still present (but moved), but not there are several other interesting features. We begin to see a repeating pattern along a diagonal line, because of a complex psuedo-period.
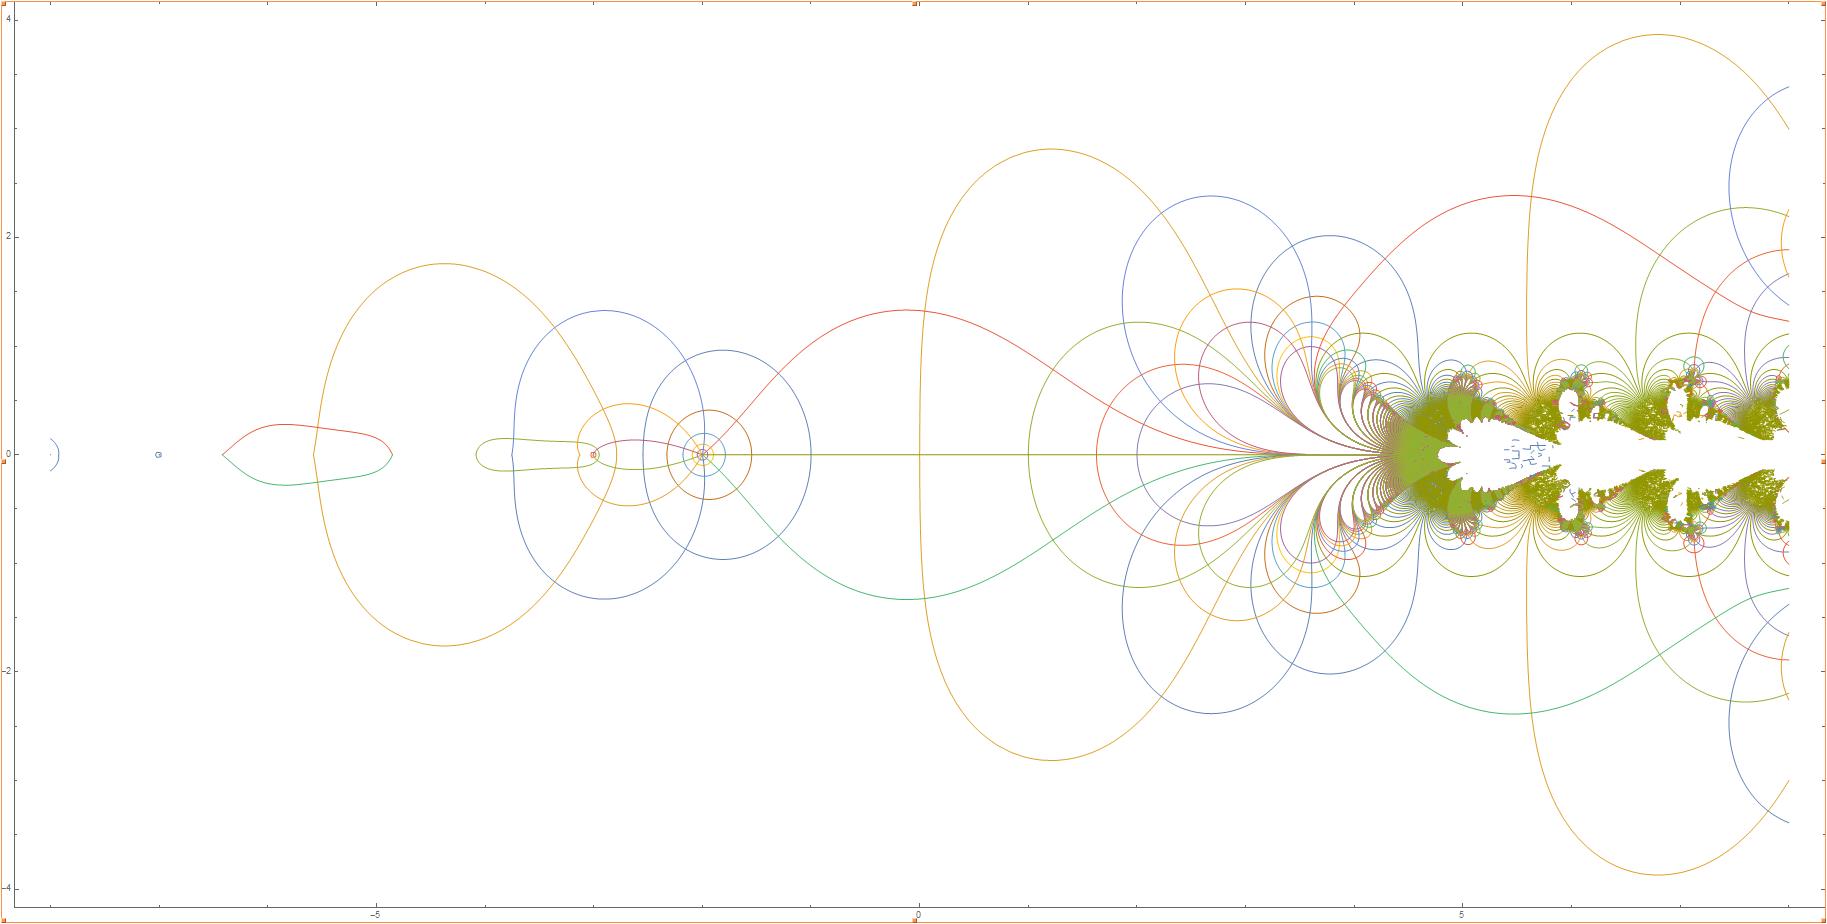
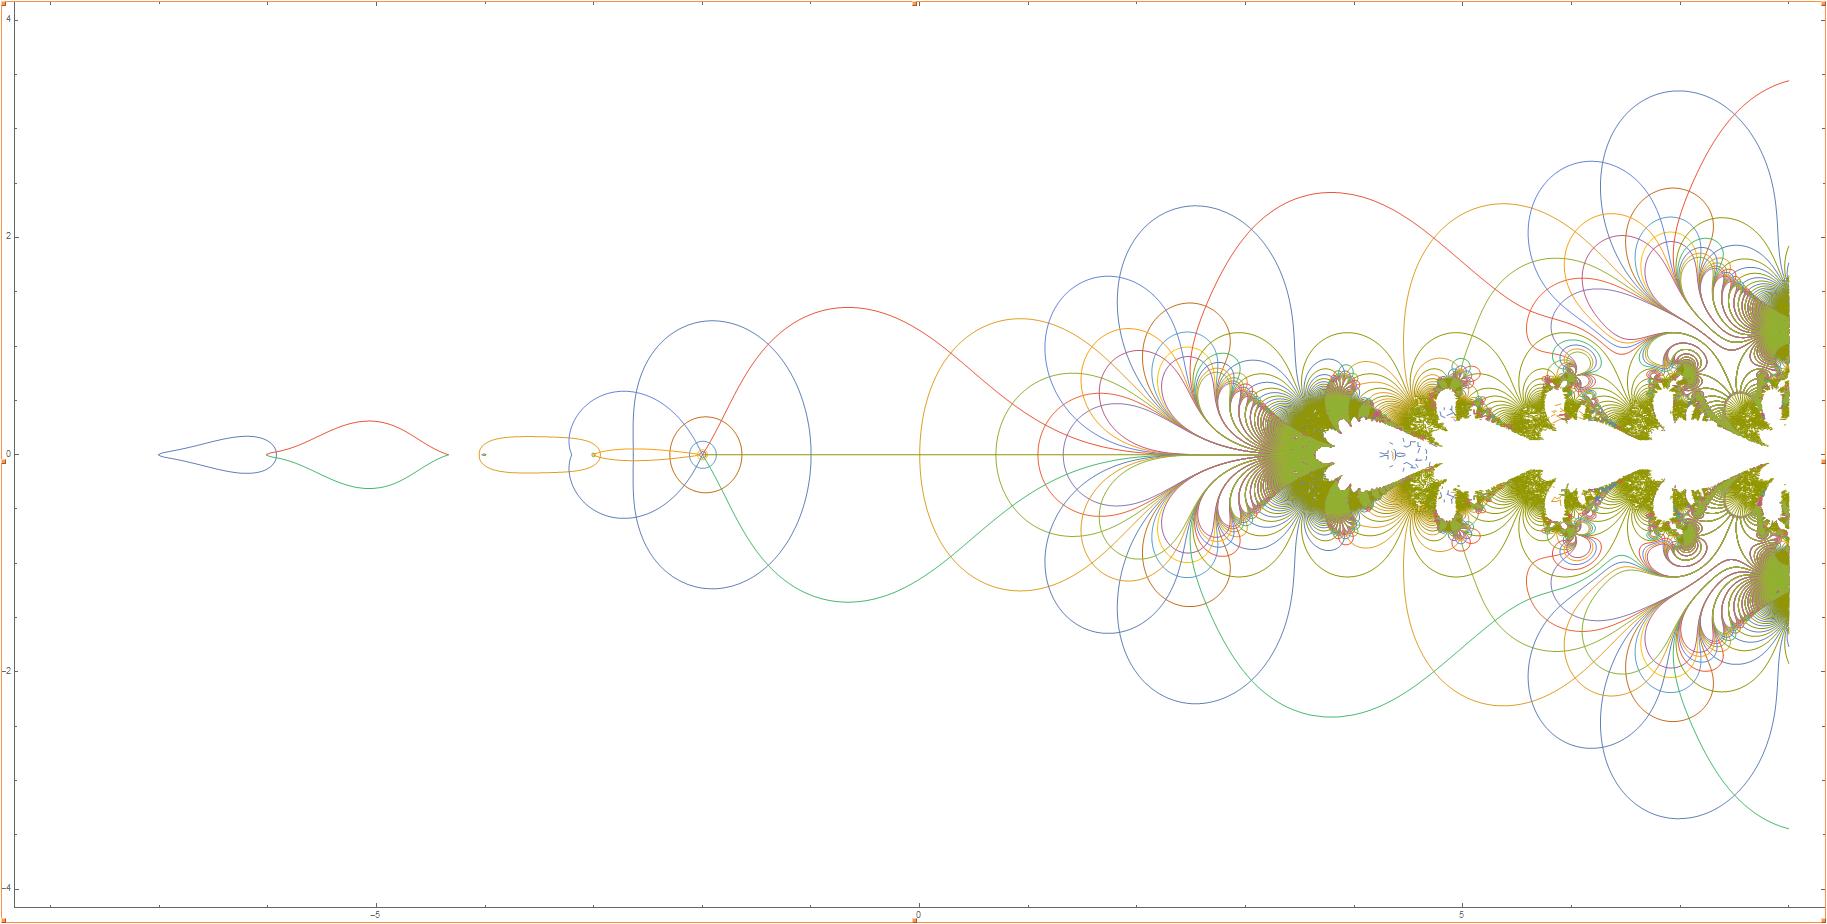
Finally, here is the contour map for the base b = 10, known as
the common tetration. It took several days for Mathematica to draw
this.

The "ears" and "wagonwheels" are still present (but moved), but not there
are several other interesting features. We begin to see a repeating
pattern along a diagonal line, because of a complex psuedo-period.
In a second paper, "Tetration for Complex Bases", Dr. Paulsen was able
to analytically extend the tetration to complex values of b. For
example, here is the contour map for the base b = 3 + i:
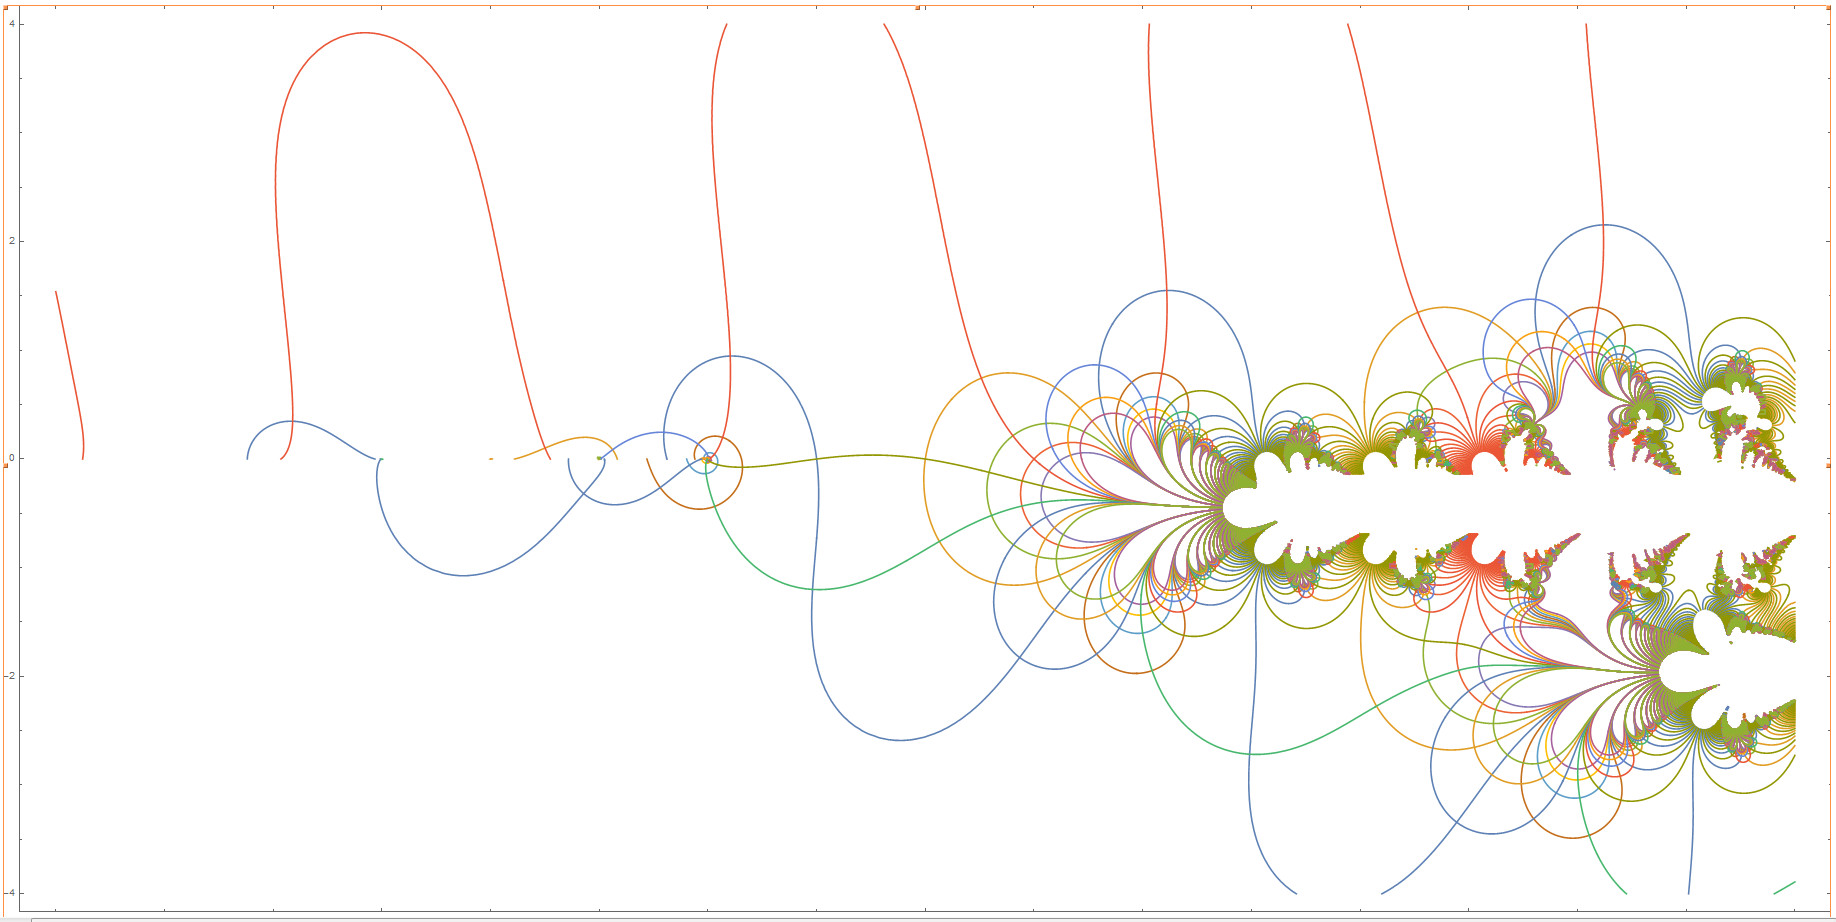
The graph is already looking asymetrical. As the base moves to b =
2 + i, the parts start to separate.
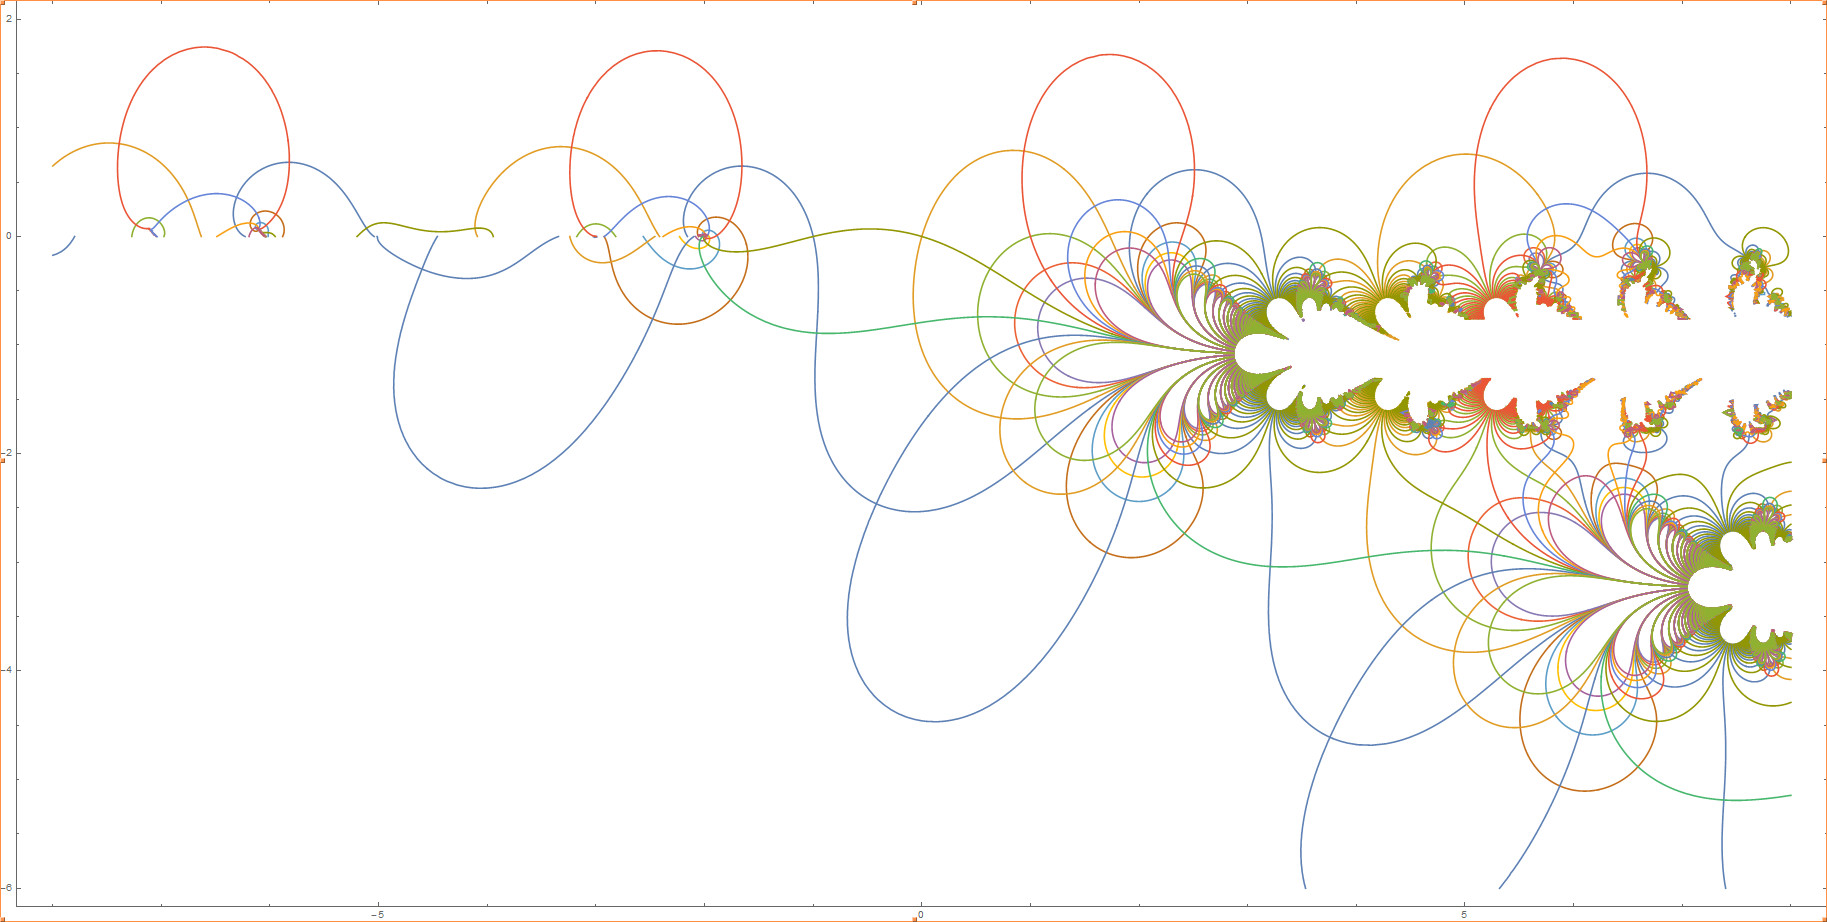
Here is the contour plot for b = 1 + i:
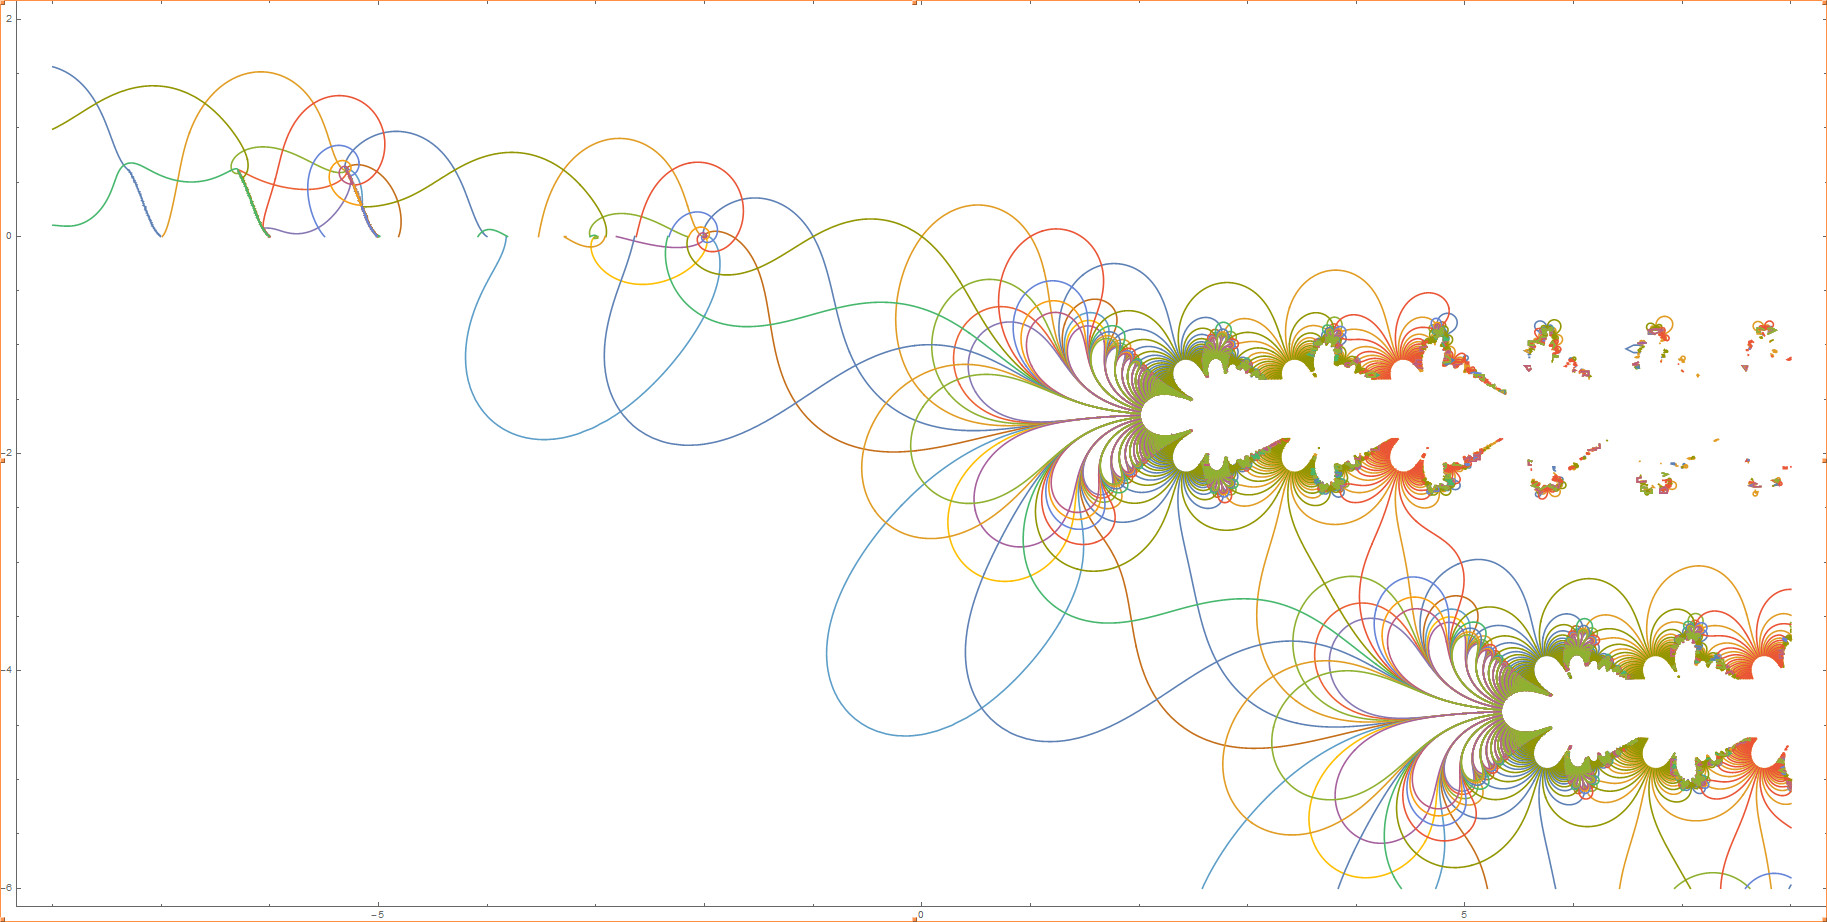
Notice that now, there are "spontaneous branch cuts" on the upper left
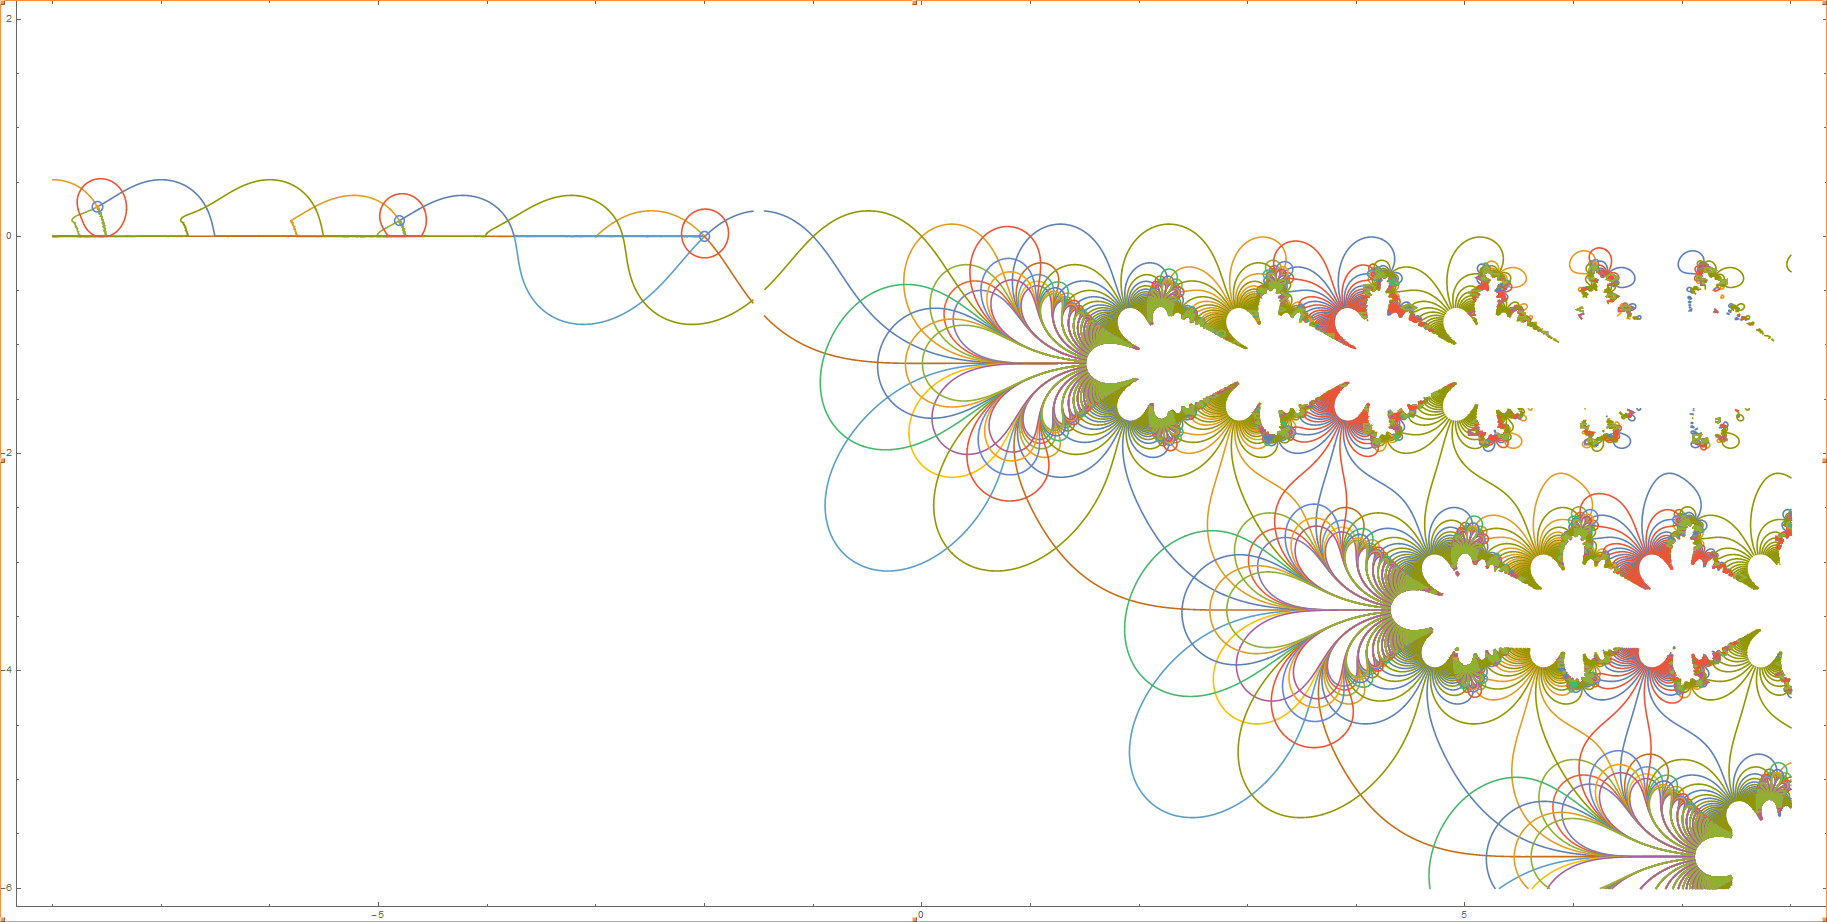
hand side of the graph. We can even go all the way to b = i:
One base of particular interest is the Sheldon base, b =
1.525982338517 + 0.0178411853321 i.

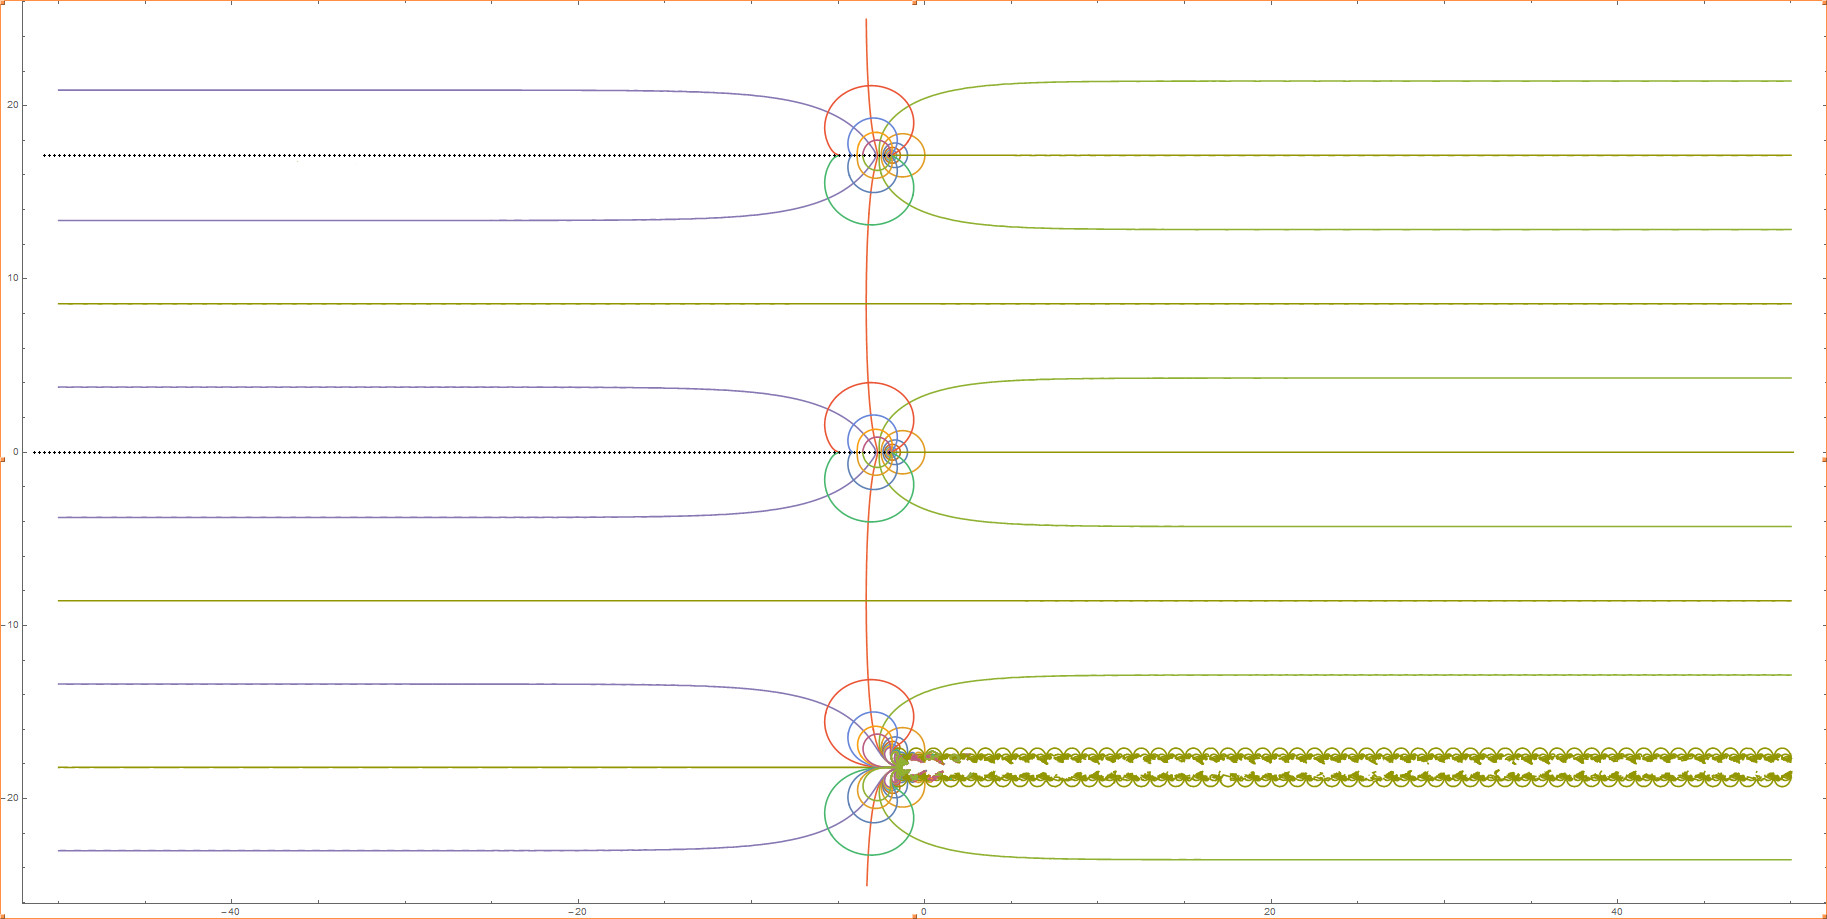
And now for something very surprising. If we analytically continue the
complex tetration back onto the real number line, between 1 and e1/e,
we do not quite get a symmetric function! Here is what we get when
we approach b = √2
from above the real axis.
The Mathematica notebooks, CrossTrack.nb and DaggerTrack.nb, that
construct the F(z) function for real and complex bases, as
well as the commands that were used to create these pictures, can be
downloaded here.